
Photography Basics
Understanding the Histogram in Photography
Your camera display is lying to you — not on purpose, but systematically. The histogram shows you what’s actually happening in your image.
01Why the Camera Display Isn’t a Reliable Reference
When you check a photo on your camera display right after taking it, you’re judging it under conditions that are anything but neutral. The display is small, its brightness reacts to your surroundings, and your eyes are constantly adjusting to whatever light is around you. Stand outside in bright sun, and almost every image will look a bit darker than it actually is. In a dark environment, those same shots suddenly look brighter and more contrasty.
Here’s what’s easy to miss: what shows up on the display isn’t a neutral readout of your shot. It’s a preview — an interpretation. Your camera is showing you an image meant to look good, not one that ruthlessly reveals exactly where detail is already being lost in the exposure.
And then there’s the fact that your eye doesn’t work like a measuring instrument. It balances out differences, evaluates brightness relative to its surroundings, and mentally “rescues” areas that may technically already be losing detail.
For a deeper look at how your camera evaluates brightness in the first place, check out our article on metering.
The histogram works differently. It has no sense of mood and doesn’t adjust for ambient light — it simply maps out how brightness is distributed across the image, objectively and without judgment. That’s exactly its value: it adds a layer to your impression that isn’t influenced by surroundings or perception, and it becomes especially critical the moment your eye reaches its limits.
02What Is a Histogram?
A histogram is a readout in your camera that shows you how brightness is distributed across your image. It says nothing about the subject or the artistic result — it simply makes visible how much shadow, midtone, and highlight brightness exists in the shot overall.
It’s not about individual areas of the frame, but the sum total of all brightness values. So the graph doesn’t tell you where the shadows or highlights are located — only how strongly they’re represented across the whole image.
That’s exactly what makes the histogram such an important exposure tool. It helps you judge whether your shot still has headroom, or whether certain brightness ranges are already hitting their limit — even when everything looks fine on the display.
03How Do I Read a Histogram?
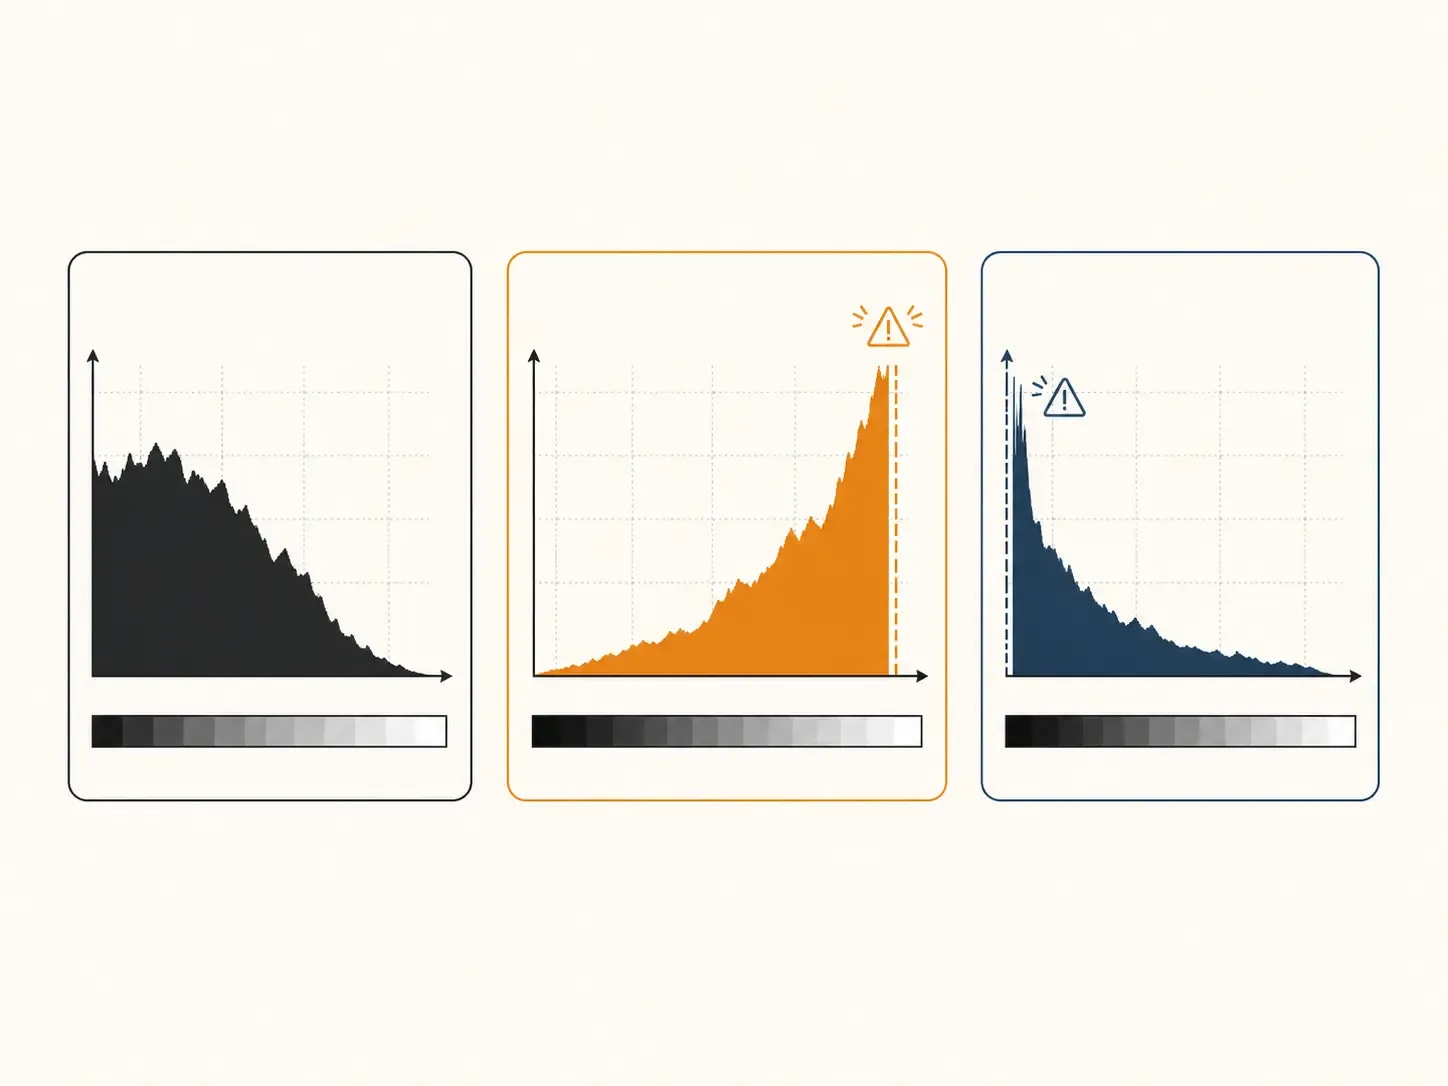
Understanding a histogram just takes a simple mental map. Dark areas of the image pile up on the left, bright areas sit on the right, and midtones fall in between.
If the histogram shifts noticeably to the right overall, your image is made up mostly of bright areas. If it shifts clearly to the left, dark areas dominate. This distribution, on its own, only describes the character of the image’s brightness — it says nothing about whether something is right or wrong.
But it’s not just the direction that matters — the height of the peaks matters too. It shows how often a particular brightness value appears in the image. A tall peak doesn’t indicate quality — it just means that tonal value is heavily represented.
Things get critical at the edges, though: if the peaks push hard against the right side, highlights are blowing out; if they crowd the left side, shadows are being crushed — and in both cases, you’re losing real detail in the image.
As a simple rule of thumb: the histogram shouldn’t sit hard against the left or right edge. If it does, there’s no detail left in those areas — they’re pure white or pure black, and there’s no fixing that later.
04Why There’s No Such Thing as a Perfect Histogram
A lot of people assume a “good” histogram needs to be evenly distributed or neatly centered. That sounds reasonable at first — balance often feels like a sign of correctness. In practice, though, that assumption leads you astray. A histogram doesn’t judge anything — it just shows what’s present in the image.
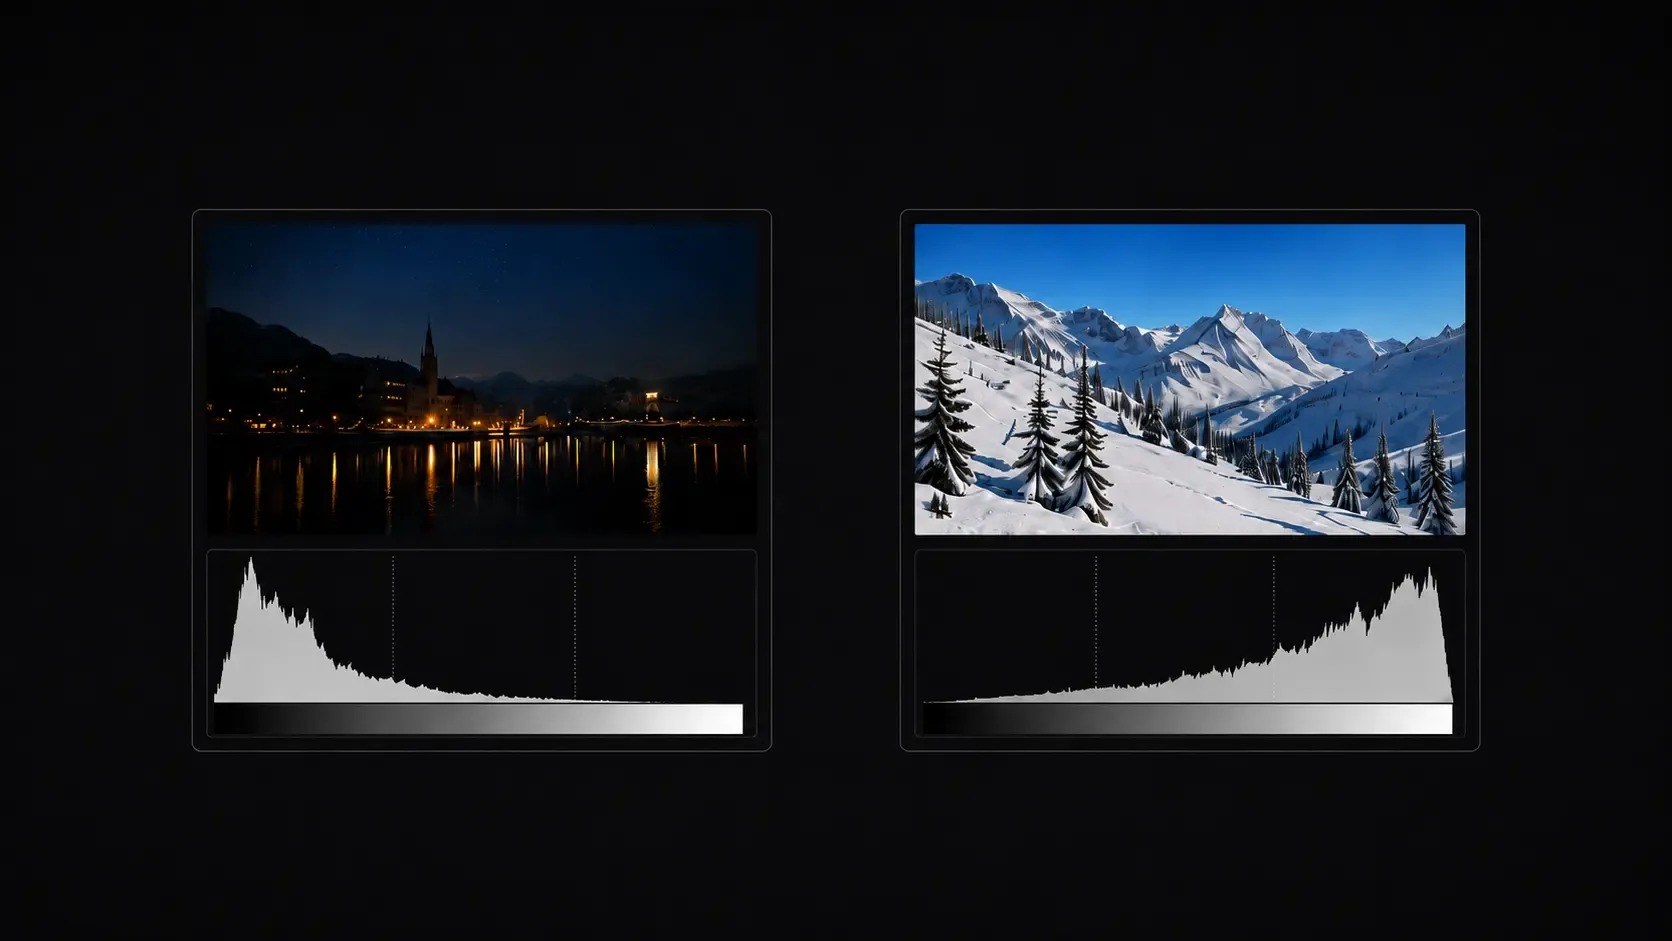
Photograph a snowy landscape, and bright areas will dominate. The histogram shifts clearly to the right because most of the frame consists of brightness. That’s not a mistake — it’s the logical result of the subject.
A night shot, or a deliberately dark portrait, behaves in exactly the opposite way. Here the peaks cluster toward the left because shadows and dark areas dominate. That’s just as correct.
The histogram doesn’t chase some ideal shape. It reacts to the light in the scene and reflects that scene’s actual brightness distribution. That’s why there’s no such thing as a “perfect” histogram — only one that fits the situation in front of you. What matters isn’t its shape, but understanding the situations where the histogram genuinely gives you certainty.
05When the Histogram Really Helps
In high-contrast situations, the value of the histogram really shows itself. A bright sky over a dark foreground, backlit scenes, or night shots with isolated light sources are all classic examples. This is exactly where our own perception can trip us up.
In situations like these, we tend to rely heavily on our first impression — and the display often seems to confirm that read. The image looks balanced there, even when it factually isn’t anymore. Your eye automatically compensates for contrast and orients itself around the overall impression. If the sky looks bright but not blinding, everything feels fine at first glance. The histogram, though, reveals whether specific areas have already gone far enough to lose detail — highlights blowing out or shadows crushing to black.
This is exactly where the histogram becomes a reliable check. It shows you whether your exposure still has headroom — or whether you need to react before detail is lost. In tricky lighting especially, this objective read often matters more than the impression on the display. In these cases, exposure compensation lets you step in and correct deliberately.
06What the Histogram Can’t Do
As useful as the histogram is in practice, it has no idea what your subject actually is. It doesn’t know what mood you’re going for, whether an image is deliberately dark, or whether bright areas are part of your creative intent. It measures brightness — it doesn’t recognize intention.
It also says nothing about composition, perspective, or the visual impact of an image, and it has no sense of tension or atmosphere. A photo can show a technically balanced brightness distribution and still feel completely unremarkable, while an image with strong peaks pressed against the edges can carry real visual impact.
This is exactly where its limits show: the histogram helps you assess exposure — and nothing more. How your image should ultimately feel is still a decision you and your eye have to make.
07What About Color?
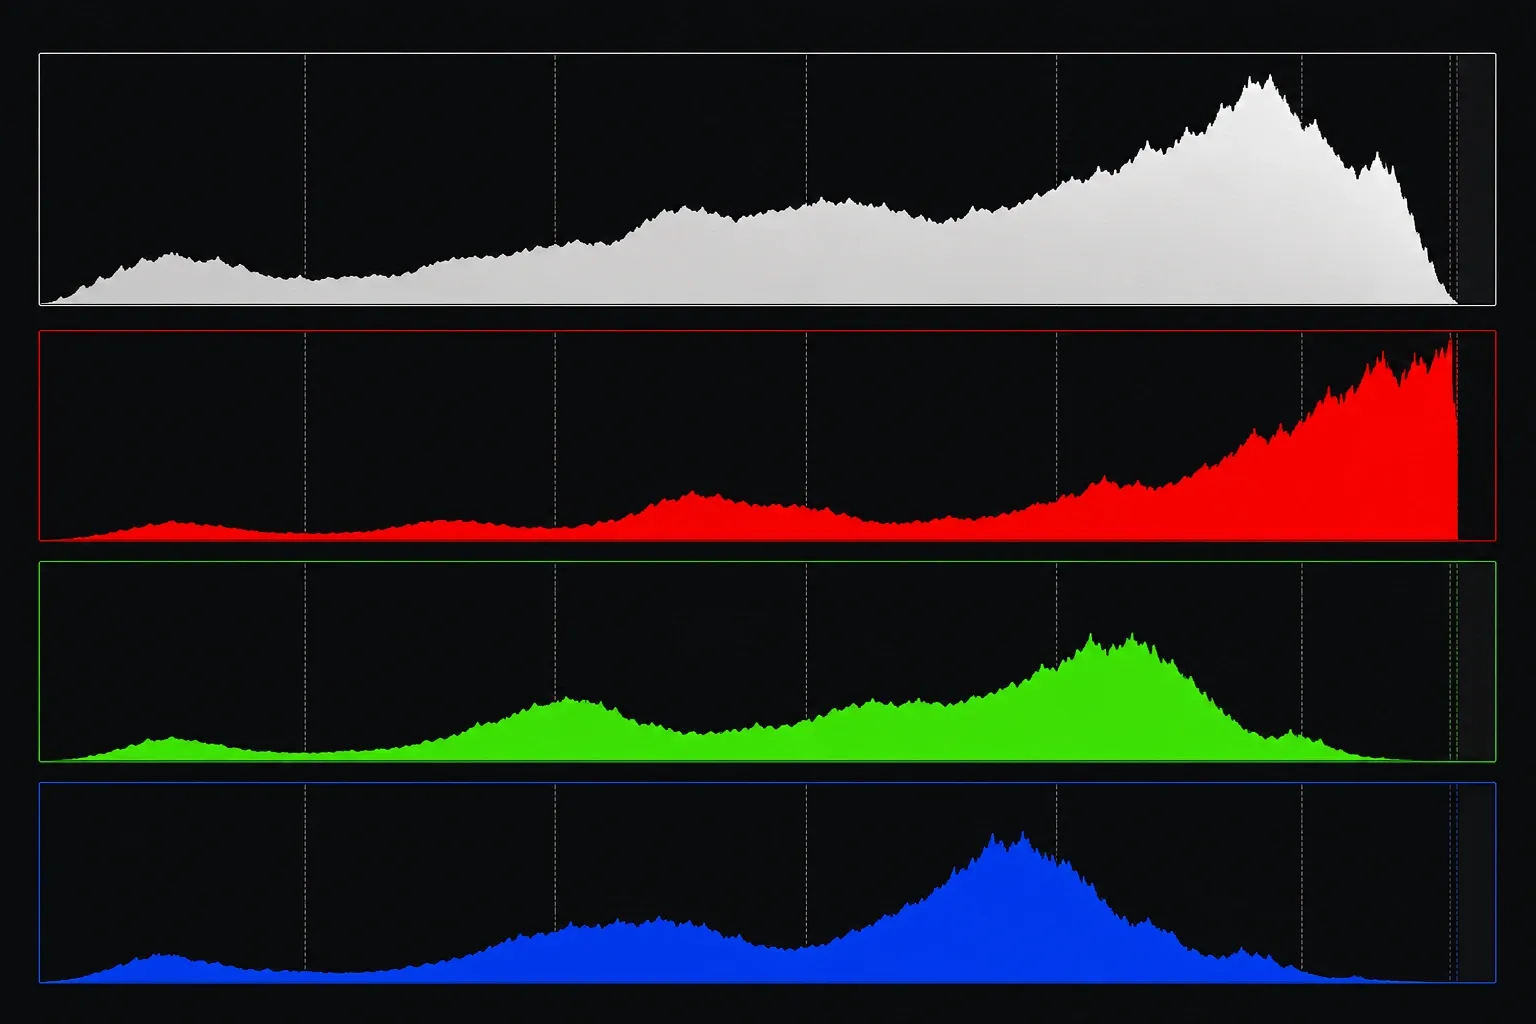
Many cameras display a color histogram alongside the standard brightness histogram. Instead of showing brightness distribution as a single combined graph, it breaks it out separately by color channel — red, green, and blue.
This becomes especially interesting when certain colors dominate the frame. An intense sunset with strong reds, or any highly saturated subject, can push individual color channels to their limit, even when the image looks perfectly balanced overall. In these situations, individual colors can clip even though the general brightness distribution looks unremarkable.
For getting started, though, it’s enough to understand the basic histogram — the distribution of light and dark. Once you’re comfortable reading that, it becomes much easier to recognize when checking individual color channels is actually worth doing. Everything else builds on that foundation.
08A Calm Look Behind the Display
The histogram doesn’t replace your feel for light, and it doesn’t make creative decisions for you. It won’t turn a weak subject into a strong photo, and it won’t hand you a creative idea. Its job is something else entirely.
It adds an objective layer to your impression. While your eye perceives mood and reads contrast relative to its surroundings, the histogram shows you what’s technically happening in the image — regardless of how it feels to you in the moment.
That’s exactly why this unassuming little graph is worth your attention — not to chase perfect curves or some “ideal” histogram shape, but to understand more clearly how light is actually distributed in your shot, and where it starts becoming a problem.
Frequently Asked Questions About the Histogram
Why does my photo look different on the display than on my computer?
The camera display is small, its brightness adapts to your surroundings, and your eyes are constantly adjusting to the ambient light too. Outdoors in bright sun, photos often look darker than they are; in dark environments, they look brighter than they actually are.
What does it mean when the histogram is pressed against the edge?
If the histogram is clearly stacked against the left or right edge, detail is being lost there. On the right edge, highlights are blown out; on the left edge, shadows are crushed — and neither can be recovered in post-processing.
Is there such a thing as a perfect histogram?
No. The histogram doesn’t judge — it simply shows what’s present in the image. A snowy landscape naturally produces a histogram shifted to the right, while a night photo skews left — both are completely normal.
What does the color histogram show me?
The color histogram shows the brightness distribution broken out by the red, green, and blue color channels. This is especially useful for highly saturated subjects like an intense sunset, where individual color channels can clip even though the image looks balanced overall.